2. 青岛海洋科学与技术国家实验室 海洋生态与环境科学功能实验室 青岛 266071;
3. 青岛农业大学资源与环境学院 青岛 266109
2. Laboratory of Marine Ecology and Environmental Sciences, Qingdao National Laboratory for Marine Science and Technology, Qingdao 266071;
3. College of Resource and Environment, Qingdao Agricultural University, Qingdao 266109
海洋中营养物质含量的高低可促进或限制海洋生态系统中的能量转化,是构成海洋生态系统物质循环的重要组成部分(孙耀等, 1996)。海水中的无机氮、无机磷等营养盐类是浮游植物生长的重要生源要素,在控制海洋初级生产力方面起着重要的作用(宋云利等, 1996; Klausmeier et al, 2004;郝林华等, 2012;隋琪等, 2016)。
桑沟湾位于山东省荣成县东部沿海,北、西、南三面为陆地,总面积为133.3 km2,通过宽10 km的湾口与黄海相连。自20世纪80年代起,人们开始在桑沟湾进行大规模的养殖活动,养殖品种主要包括海带(Laminaria japonica)、长牡蛎(Crassostrea gigas)和栉孔扇贝(Chlamys farreri)等,桑沟湾已成为我国北方重要的半封闭型海湾规模化海水养殖示范区(尹相淳, 1988;张继红等, 2012;夏斌等, 2013)。但随着工业污水的大量排海及海产品的过度养殖等,桑沟湾水环境受损,海区产量持续下降(石洪华等, 2008;张继红等, 2011)。因此,调查研究桑沟湾海域的营养盐,对该区域养殖生产活动和生态环境保护具有重大指导意义。目前,有关桑沟湾养殖海域的水环境特征的报道,主要是对桑沟湾营养盐的时空分布和营养盐限制的分析评价(乔聚海, 1988;连岩等, 1998;孙耀等, 1998;刘慧等, 2003;孙丕喜等, 2007;曲克明等, 2008;孙珊等, 2010;张继红等, 2010、2012;郝林华等, 2012)。关于桑沟湾近年来营养盐时空分布变化和全湾不同区域营养盐季节变化特征分析的研究报道较少。本研究根据2014年10月、2015年3月、5月和8月在桑沟湾养殖水域开展的海洋调查所获得的营养盐资料,分析了桑沟湾养殖海区主要营养盐的季节变化及限制因子,掌握桑沟湾最新的水质营养状况及时空分布变化特征,为实现桑沟湾生态环境的有效保护和健康生态养殖管理提供科学依据,并为推动我国生态系统水平的高效、持续海水养殖提供技术支撑。
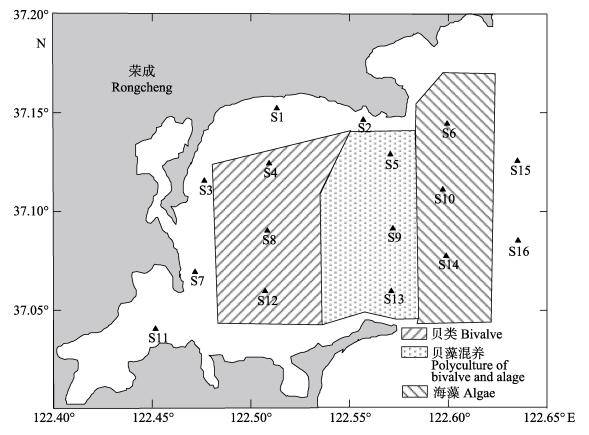
1 材料与方法 1.1 采样站位与时间分别于2014年10月(秋季)、2015年3月(冬季)、5月(春季)和8月(夏季)在桑沟湾养殖水域布设16个调查站位(图 1),采集水样,其中,S1、S2、S3、S7、S11号站位于近岸区域,S4、S8、S12号站位于贝类养殖区,S5、S9、S13号站位于贝藻混养区,S6、S10、S14号站位于藻类养殖区,S15、S16号站位于外海海域。

|
图 1 调查区域及站位 Figure 1 Investigation area and sampling stations |
样品的测定分析参数包括亚硝酸盐(NO2-N)、硝酸盐(NO3-N)、氨氮(NH4-N)和磷酸盐(PO4-P)。NO2-N采用萘乙二胺分光光度法测定,NO3-N采用镉柱还原法测定,NH4-N采用次溴酸盐氧化法测定,PO4-P采用磷钼蓝分光光度法测定。采样的层次为表、底层。样品的采集和现场处理及分析方法均参照《海洋监测规范》(GB17378.4-2007) 执行。同时,采用美国YSI556型多参数水质监测仪测定海水表层温度、盐度等环境参数。
1.3 富营养化评价方法根据郭卫东等(1998) 提出的潜在性富营养化评价模式,对桑沟湾养殖海域四个季节总体富营养化水平进行评价,营养级的划分见表 1。
|
|
表 1 潜在性富营养化评价标准(郭卫东等, 1998) Table 1 Potential eutrophication assessment standards (Guo et al, 1998) |
春季桑沟湾调查海域表层水温范围为11.91-17.57℃,平均值为14.76℃。其水平分布总体表现为由湾口向湾内逐渐递增的趋势(图 2-a)。夏季桑沟湾表层水温范围为21.72-25.95℃,平均值为24.02℃,其水平分布总体亦表现为由湾口向湾内逐渐递增的趋势(图 2-b)。秋季桑沟湾表层水温范围为16.47-18.48℃,平均值为17.90℃,其水平分布总体表现为由湾口向湾内逐渐递减的趋势(图 2-c)。冬季桑沟湾表层水温范围为3.33-8.48℃,平均值为5.61℃,其水平分布总体表现为由湾口向湾内逐渐递增的趋势(图 2-d)。调查期间,桑沟湾养殖海域表层水温介于3.33-25.95℃之间,水温高值出现在8月,低值出现在3月。桑沟湾湾内水深较浅,水深自湾底向湾口递增,由于湾内水深较浅,水温易受气温、光照等环境因子的影响(乔聚海, 1988;尹相淳, 1988;张继红等, 2010)。春季和夏季湾内水温上升较快,表现为湾内水温高于湾口;秋季湾内水温下降较快,表现为湾内水温低于湾口,与同期文献报道基本一致(连岩等, 1998;孙珊等, 2010;张继红等, 2010、2012)。

|
图 2 桑沟湾四季水温的平面分布 Figure 2 Horizontal distribution of water temperature in Sanggou Bay during four seasons |
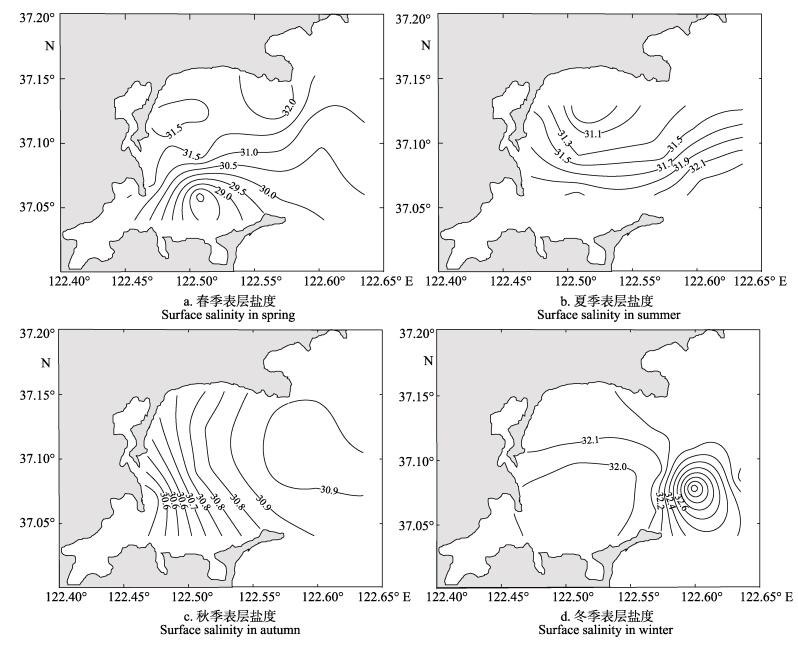
春季桑沟湾调查海域表层盐度范围为27.83-32.51,平均值为30.96,其水平分布总体表现为由南向北逐渐递增的趋势(图 3-a)。夏季桑沟湾表层盐度范围为30.94-32.29,平均值为31.68,其水平分布总体表现为由南向北逐渐递减的趋势(图 3-b)。秋季桑沟湾表层盐度范围为30.46-30.97,平均值为30.83,其水平分布总体表现为由湾口向湾内逐渐递减的趋势(图 3-c)。冬季桑沟湾表层盐度范围为31.91-33.08,平均值为32.18,其水平分布总体亦表现为由湾口向湾内逐渐递减的趋势(图 3-d)。调查期间,桑沟湾养殖海域盐度介于27.83-33.08之间,盐度高值出现在3月,低值出现在5月。本研究结果与已有报道结果相似(连岩等, 1998;孙珊等, 2010;张继红等, 2010),桑沟湾养殖海域盐度的总体趋势表现为湾外高于湾内,这主要是由于陆地径流或降雨导致的。

|
图 3 桑沟湾四季盐度的平面分布 Figure 3 Horizontal distribution of salinity in Sanggou Bay during four seasons |
桑沟湾调查海域,春季NO2-N、NO3-N、NH4-N、PO4-P的表、底层平均浓度分别为5.14、39.55、79.67、13.15 μg/L;夏季NO2-N、NO3-N、NH4-N、PO4-P的表、底层平均浓度分别为12.63、33.09、77.86、12.52 μg/L;秋季NO2-N、NO3-N、NH4-N、PO4-P的表、底层平均浓度分别为11.47、107.71、39.68、22.99 μg/L;冬季NO2-N、NO3-N、NH4-N、PO4-P的表、底层平均浓度分别为12.14、41.05、72.08、24.44 μg/L。桑沟湾水域NO2-N的平均含量春季最低而夏季最高;NO3-N的平均含量夏季最低而秋季最高;NH4-N的平均含量秋季最低而春季最高;PO4-P的平均含量夏季最低而冬季最高(表 2)。从季节性变化来看,DIN含量为秋季 > 冬季 > 春季 > 夏季,PO4-P含量为冬季 > 秋季 > 春季 > 夏季,与现有报道的桑沟湾营养盐季节分布状况基本一致(张继红等, 2010;郝林华等, 2012)。
|
|
表 2 桑沟湾海区四季营养盐平均浓度 Table 2 The average concentration of nutrients in Sanggou Bay during four seasons (μg/L) |
在春季、夏季和冬季的调查中,NH4-N为溶解无机氮的主要存在形式,所占比例分别为表层64.3%、62.2%和58.4%,底层为63.9%、63.8%和56.8%;表层秋季NO3-N占无机氮的66.7%,底层占69.4%;春季、夏季、秋季和冬季表层NO2-N分别占无机氮的4.1%、11.8%、5.9%和10.1%,底层分别占4.1%、8.7%、9.1%和9.3%。桑沟湾海域,无机氮总体水平低于海水一类标准值(200 μg/L)。其中,秋季表层有7个站位无机氮含量超过海水一类标准值,超标率为43.8%;春季、秋季和冬季底层分别有1、3和2个站位无机氮含量超过海水一类标准值,超标率分别为6.7%、18.8%和13.3%;春季和夏季PO4-P总体水平低于海水一类标准值(15 μg/L),其中,表层均有5个测站PO4-P含量超过海水一类标准值,超标率均为33.3%,底层分别有5和3个站位PO4-P含量超过海水一类标准值,超标率分别为33.3%和18.7%;秋季和冬季PO4-P总体水平高于海水一类标准值(15 μg/L),其中,表层分别有11和9个测站PO4-P含量超过海水一类标准值,超标率分别为68.8%和60.1%,底层有13和11个测站PO4-P含量超过海水一类标准值,超标率分别为81.3%和73.3%。虽然桑沟湾养殖贝类排泄的大量氮磷营养盐会导致养殖水域环境呈现富营养化,但大规模养殖的大型藻类作为生物滤器能够吸收水体中多余的营养盐,并转化为具有较高价值的水产品,同时达到对环境的净化作用(Nelson et al, 2001)。因此,桑沟湾贝藻养殖起到了一定程度的海水净化作用,故营养盐的浓度远远低于胶州湾和乳山湾等海湾(Shen, 2001;辛福言等, 2004;孙珊等, 2010;张继红等, 2010), 水质能够达到国家一类或二类的海水水质标准。在桑沟湾实施的以贝藻为主体的多营养层次综合养殖能够更好地彰显水产养殖的生态服务功能,为环境友好型水产养殖业的代表性发展模式,可为推动我国生态系统水平的高效、持续海水养殖提供重要的技术支撑(蒋增杰等, 2012;唐启升等, 2013)。
2.3 桑沟湾营养盐的平面分布特征由图 4可见,春季溶解无机氮(DIN)表、底层分布趋势基本一致,自湾外东北部向湾内西南方向逐渐降低,呈现湾内低、湾外高的趋势(图 4-a、b);夏季DIN表、底层分布趋势亦基本一致,自中部水域向湾外东南方向逐渐降低,呈现湾内高、湾外低的趋势(图 4-c、d);秋季DIN表、底层分布趋势基本一致,自湾内南部水域向湾外东北方向逐渐降低,呈现湾内高、湾外低的趋势(图 4-e、f);冬季表层DIN呈现自湾内南部水域向北逐渐降低的趋势,冬季底层DIN在湾内中部偏东水域形成一较密集闭合区,并呈现由中心向外逐渐降低的趋势(图 4-g、h)。

|
图 4 桑沟湾四季溶解无机氮的平面分布 Figure 4 Horizontal distribution of dissolved inorganic nitrogen (DIN) in Sanggou Bay during four seasons |
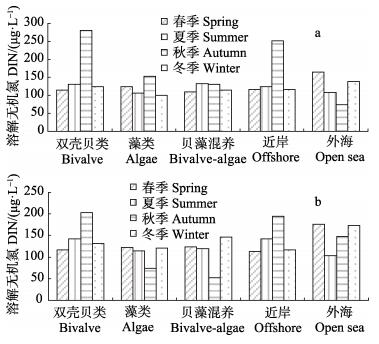
桑沟湾不同区域营养盐的浓度受养殖活动和外界海水影响较大(孙珊等, 2010),季节变化明显。同时,由湾底向湾口依次排列的贝类养殖区、贝藻混养区、藻类养殖区等形成了桑沟湾特有的多元养殖模式,导致湾内外海水的交换受到一定程度的制约(刘慧等, 2003;郝林华等, 2012),大大降低了湾内营养盐的补充量。春季外海区域表层DIN的平均浓度最高,贝藻混养区域表层DIN的平均浓度最低;夏季贝藻混养区域表层DIN的平均浓度最高,藻类养殖区域表层DIN的平均浓度最低;秋季贝类养殖区域表层DIN的平均浓度最高,外海区域表层DIN的平均浓度最低;冬季外海区域表层DIN的平均浓度最高,藻类养殖区域表层DIN的平均浓度最低(图 5-a)。春季外海区域底层DIN的平均浓度最高,近岸区域底层DIN的平均浓度最低;夏季近岸区域底层DIN的平均浓度最高,外海区域底层DIN的平均浓度最低;秋季贝类养殖区域底层DIN的平均浓度最高,贝藻混养区域底层DIN的平均浓度最低;冬季外海区域底层DIN的平均浓度最高,近岸区域底层DIN的平均浓度最低(图 5-b)。本研究中,秋季贝类养殖区域DIN的浓度最高,这是由于桑沟湾养殖水域滤食性贝类的排氨率在秋季达到最高所致(牛亚丽, 2014)1)。

|
图 5 桑沟湾四季不同区域溶解无机氮浓度 Figure 5 Regional distribution of dissolved inorganic nitrogen (DIN) in Sanggou Bay during four seasons a:表层;b:底层 a. Surface; b. Bottom |
1) Niu YL. Study on seasonal variation of the C, N, P, Si budget of the bivalves in Sungo Bay. Masterxs Thesis of Zhejiang Ocean University, 2014, 28-40 [牛亚丽.桑沟湾滤食性贝类碳、氮、磷、硅元素收支的季节变化研究.浙江海洋学院硕士研究生学位论文, 2014, 28-40]
由图 6可见,春季表层PO4-P分别在湾内西北和西南部水域形成了2个较密集闭合区,并呈现由中心向外逐渐降低的趋势,春季底层PO4-P在湾内中部水域形成了一较密集闭合区,并呈现由中心向外逐渐下降的趋势(图 6-a、b);夏季PO4-P表、底层分布趋势基本一致,均呈现自中部水域向外逐渐上升的趋势(图 6-c、d);秋季PO4-P表、底层分布趋势亦基本一致,自湾内西部水域向东逐渐降低,呈现湾内高、湾外低的趋势(图 6-e、f);冬季PO4-P表、底层分布趋势基本一致,在湾内中部偏东水域形成一较密集闭合区,并呈现由中心向外逐渐降低的趋势(图 6-g、h)。

|
图 6 桑沟湾四季PO4-P的平面分布 Figure 6 Horizontal distribution of PO4-P in Sanggou Bay during four seasons |
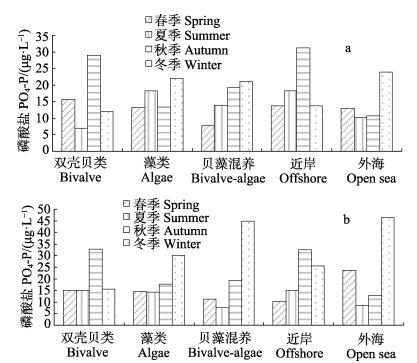
桑沟湾海域,春季表层PO4-P的平均浓度在贝类养殖区域最高,在贝藻混养区域最低;夏季表层PO4-P的平均浓度在近岸和藻类养殖区域最高,在贝类养殖区域最低;秋季表层PO4-P的平均浓度在近岸区域最高,在外海区域最低(P < 0.05);冬季表层PO4-P的平均浓度在外海区域最高,在贝类养殖区域最低(图 7-a)。春季底层PO4-P的平均浓度在外海区域最高,在近岸区域最低(图 7-b);夏季底层PO4-P的平均浓度在近岸和藻类养殖区域最高,在贝藻混养区域最低;秋季底层PO4-P的平均浓度在贝类养殖区域最高,在外海区域最低;冬季底层PO4-P的平均浓度在外海区域最高,在贝类养殖区域最低(P < 0.05)。本研究中,春季贝类养殖区域的PO4-P浓度最高,这与万玲(2012) 的研究结果相一致,这主要是由于贝类排泄和沉积物释放所导致(孙丕喜等, 2007;郝林华等, 2012)。春季海带正处于高速生长和繁殖期,会大量吸收营养盐,而在夏季海带收获后,则大大缓解了营养盐的限制压力(吴文广等, 2015),导致春季藻类养殖区域的PO4-P浓度低于夏季。夏季桑沟湾海域不同区域的PO4-P浓度较低,这是由于夏季海带收获后,大片海域成为空闲海区,浮游植物缺乏营养盐的竞争而快速生长,大量消耗营养盐所致(吴文广等, 2015)。

|
图 7 桑沟湾四季不同区域PO4-P浓度 Figure 7 Regional distribution of PO4-P concentration in Sanggou Bay during four seasons a:表层;b:底层 a: Surface; b: Bottom |
有研究表明,浮游植物通常以约为16:1的N/P比值自海水中摄取氮和磷,过高或过低于Redfield比值,均会引起浮游植物的生长受限(Redfield et al, 1963; Pilson, 1985;郝林华等, 2012)。桑沟湾调查海域,春季表底层N/P比值均高于Redfield比值,分别比正常N/P比值高1.71倍和1.57倍,春季无机磷显得相对缺乏,为浮游植物生长的限制因子。夏季表、底层N/P比值亦均高于Redfield比值,分别比正常N/P比值,高1.78倍和1.76倍,夏季无机磷亦显得相对缺乏,为浮游植物生长的限制因子。秋季表层N/P比值高于Redfield比值,比正常N/P比值高1.28倍,底层N/P比值低于Redfield比值,秋季营养盐结构总体水平与Redfield比值基本一致。冬季表层N/P比值高于Redfield比值,比正常N/P比值高1.14倍,底层N/P比值低于Redfield比值,冬季营养盐结构总体水平略高于Redfield比值,无机磷略显缺乏(表 3)。与20世纪八九十年代报道的数据相比(乔聚海, 1988;宋云利等, 1996;孙耀等, 1996),本研究结果与近年的研究报道相一致,桑沟湾浮游植物生长的主要限制性因素,已由整体的氮限制转变为春、夏季磷限制为主(孙丕喜等, 2007;孙珊等, 2010;张继红等, 2010、2011;万玲, 2012)。
|
|
表 3 桑沟湾海区四季营养盐相对组成 Table 3 The relative composition of nutrients in Sanggou Bay |
富营养化评价结果显示,桑沟湾养殖水域营养水平较低,四个季节均属贫营养水平(表 4)。本研究结果与现有研究报道相一致(孙丕喜等, 2007;张继红等, 2011;万玲, 2012),桑沟湾营养水平较低,水质较好。这主要是与桑沟湾养殖海域中构建的多营养层次综合养殖模式有关,一方面该养殖模式促进了海洋生态系统的高效产出,保障了水产品的持续供给;另一方面,其最大程度地挖掘了以碳汇扩增为特点的生态服务功能,保障了生态系统健康(蒋增杰等, 2012;唐启升等, 2013)。当然,在今后桑沟湾养殖模式发展的过程中,仍然需要特别关注养殖生态容纳量与养殖品种的搭配、营养物质循环与养殖生物的互补互益、系统产出与生态和社会经济效益等科学数据(唐启升等, 2013)。
|
|
表 4 桑沟湾海区四季营养类型评价 Table 4 Nutrient type assessment in Sanggou Bay during four seasons |
桑沟湾养殖海域秋季无机氮含量明显高于其他三个季节。NO2-N的平均含量夏季最高,春季最低;NO3-N的平均含量秋季最高,夏季最低;NH4-N的平均含量春季最高,秋季最低;PO4-P的平均含量冬季最高,夏季最低。相比海水水质标准,各季节无机氮总体水平均低于海水一类标准值,春季和夏季PO4-P总体水平低于海水一类标准值,秋季和冬季PO4-P总体水平则高于海水一类标准值。
从水平分布看,春季溶解无机氮含量呈现湾内低、湾外高的趋势,夏季和秋季呈现湾内高、湾外低的趋势,冬季呈现自湾内南部水域向北逐渐降低的趋势。春季和冬季PO4-P含量均呈现自湾内中部水域向外逐渐下降的趋势,夏季呈现自湾内中部水域向外逐渐上升的趋势;秋季则呈现湾内高、湾外低的趋势。
春季、夏季和冬季,桑沟湾养殖海域营养盐结构总体水平高于Redfield比值,无机磷成为浮游植物生长的限制因子。而秋季营养盐结构总体水平与Redfield比值基本一致。
运用潜在性富营养化评价模式分析显示,桑沟湾养殖海域营养水平较低,四个季节均属贫营养水平。
| General Administration of Quality Supervision, Inspection and Quarantine of the People's Republic of China, Standardization Administration of the People's Republic of China. The specification for marine monitoring-Part 4: Seawater analysis (GB17378.4-2007). Beijing: China Standards Press, 2007 | |
| 中华人民共和国国家质量监督检验检疫总局, 中国国家标准化管理委员会. 海洋监测规范—第4部分: 海水分析(GB17378. 4-2007). 北京: 中国标准出版社, 2007 | |
| Guo WD, Zhang XM, Yang YP, et al. Potential eutrophication assessment for Chinese coastal waters. Journal of Oceanography in Taiwan Strait, 1998, 17(1): 64-70[郭卫东, 章小明, 杨逸萍, 等. 中国近岸海域潜在性富营养化程度的评价. 台湾海峡, 1998, 17(1): 64-70] | |
| Hao LH, Sun PX, Hao JM, et al. The spatial and temporal distribution of chlorophyll-a and its influencing factors in Sanggou Bay. Ecology and Environmental Sciences, 2012, 21(2): 338-345[郝林华, 孙丕喜, 郝建民, 等. 桑沟湾海域叶绿素a的时空分布特征及其影响因素研究. 生态环境学报, 2012, 21(2): 338-345] | |
| Jiang ZJ, Fang JG, Mao YZ, et al. Environmental effect of marine fish cage aquaculture and integrated multi-trophic aquaculture. Environmental Sciences and Management, 2012, 37(1): 120-124[蒋增杰, 方建光, 毛玉泽, 等. 海水鱼类网箱养殖的环境效应及多营养层次的综合养殖. 环境科学与管理, 2012, 37(1): 120-124] | |
| Klausmeier CA, Litchman E, Daufresne T, et al. Optimal nitrogen-to-phosphorus stoichiometry of phytoplankton. Nature, 2004, 429(6988): 171-174 DOI:10.1038/nature02454 | |
| Lian Y, Wang LC, Li SK, et al. An investigation on chemistry of seawater of Sanggou Bay. Journal of Oceanography of Huanghai & Bohai Seas, 1998, 16(3): 60-66[连岩, 王立超, 李胜宽, 等. 桑沟湾海水化学调查. 黄渤海海洋, 1998, 16(3): 60-66] | |
| Liu H, Fang JG, Dong SL, et al. Annual variation of major nutrients and limiting factors in Laizhou Bay and Sanggou Bay. Journal of Fishery Sciences of China, 2003, 10(3): 227-234[刘慧, 方建光, 董双林, 等. 莱州湾和桑沟湾养殖海区主要营养盐的周年变动及限制因子. 中国水产科学, 2003, 10(3): 227-234] | |
| Nelson SG, Glenn EP, Conn J, et al. Cultivation of Gracilaria parvispora (Rhodophyta) in shrimp-farm effluent ditches and floating cages in Hawaii: A two-phase polyculture system. Aquaculture, 2001, 193(3-4): 239-248 DOI:10.1016/S0044-8486(00)00491-9 | |
| Pilson MEQ. Annual cycles of nutrients and chlorophyⅡ in Narragansett Bay, Rhode Island. Journal of Marine Research, 1985, 43(4): 849-873 DOI:10.1357/002224085788453949 | |
| Qiao JH. The geochemical characteristics of phosphorus in seawater of the Sanggou Bay. Bulletin of Mineralogy, Petrology and Geochemistry, 1988, 11061106(1): 3-4[乔聚海. 桑沟湾海水中磷的地球化学特征. 矿物岩石地球化学通报, 1988, 11061106(1): 3-4] | |
| Qu KM, Song YL, Xu Y, et al. Experiment on nutrient limitations in cultured areas of Sanggou Bay in situ in spring and summer. Marine Environmental Science, 2008, 27(2): 124-127[曲克明, 宋云利, 徐勇, 等. 桑沟湾养殖水域春季和夏季营养限制的现场实验. 海洋环境科学, 2008, 27(2): 124-127] | |
| Redfield AC. The influence of organisms on the composition of sea-water. Mat Zametki, 1963, 40(6): 640-644 | |
| Shen ZL. Historical changes in nutrient structure and its influences on phytoplankton composition in Jiaozhou Bay. Estuarine, Coastal and Shelf Science, 2001, 52: 211-224 DOI:10.1006/ecss.2000.0736 | |
| Shi HH, Zheng W, Ding DW, et al. Valuation of typical marine ecosystem services—A case study in Sanggou Bay. Marine Environmental Science, 2008, 27(2): 101-104[石洪华, 郑伟, 丁德文, 等. 典型海洋生态系统服务功能及价值评估—以桑沟湾为例. 海洋环境科学, 2008, 27(2): 101-104] | |
| Song YL, Cui Y, Sun Y, et al. Study on nutrient state and influencing factors in Sanggou Bay. Marine Fisheries Research, 1996, 17(2): 41-51[宋云利, 崔毅, 孙耀, 等. 桑沟湾养殖海域营养状况及其影响因素分析. 海洋水产研究, 1996, 17(2): 41-51] | |
| Sui Q, Xia B, Xie HB, et al. Study on temporal and spatial variation of nutrients and evaluation on eutrophication in the seawater of the Bohai Sea in winter and spring of 2014. Progress in Fishery Sciences, 2016, 37(2): 10-15 DOI:10.11758/yykxjz.20150309002[隋琪, 夏斌, 谢寒冰, 等. 2014年春季和冬季渤海海水营养盐时空变化特征及富营养化评价. 渔业科学进展, 2016, 37(2): 10-15] | |
| Sun PX, Zhang ZH, Hao LH, et al. Analysis of nutrient distributions and potential eutrophication in seawater of the Sanggou Bay. Advances in Marine Science, 2007, 25(4): 436-445[孙丕喜, 张朝晖, 郝林华, 等. 桑沟湾海水中营养盐分布及潜在性富营养化分析. 海洋科学进展, 2007, 25(4): 436-445] | |
| Sun S, Liu SM, Ren JL, et al. Distribution features of nutrients and flux across the sediment-water interface in the Sanggou Bay. Acta Oceanologica Sinica, 2010, 32(6): 108-117[孙珊, 刘素美, 任景玲, 等. 桑沟湾养殖海域营养盐和沉积物-水界面扩散通量研究. 海洋学报, 2010, 32(6): 108-117] | |
| Sun Y, Song YL, Cui Y, et al. Distribution and behavior of inorganic nitrogen nutrients in Sanggou Bay. Marine Fisheries Research, 1996, 17(2): 52-59[孙耀, 宋云利, 崔毅, 等. 桑沟湾养殖海域无机氮营养盐的分布与行为. 海洋水产研究, 1996, 17(2): 52-59] | |
| Sun Y, Zhao J, Zhou SL, et al. Environmental features of cultural waters in Sanggou Bay. Journal of Fishery Sciences of China, 1998, 5(3): 69-75[孙耀, 赵俊, 周诗赉, 等. 桑沟湾养殖海域的水环境特征. 中国水产科学, 1998, 5(3): 69-75] | |
| Tang QS, Fang JG, Zhang JH, et al. Impacts of multiple stressors on coastal ocean ecosystems and integrated multi-trophic aquaculture. Progress in Fishery Sciences, 2013, 34(1): 1-11[唐启升, 方建光, 张继红, 等. 多重压力胁迫下近海生态系统与多营养层次综合养殖. 渔业科学进展, 2013, 34(1): 1-11] | |
| Wan L. Effect of shellfish farming on nutrient salts of seawater in Sanggou Bay in spring. Environmental Science and Management, 2012, 37(6): 62-66[万玲. 春季桑沟湾海域贝类养殖对海水中营养盐的影响研究. 环境科学与管理, 2012, 37(6): 62-66] | |
| Wu WG, Zhang JH, Wang W, et al. Variation of Chl. a concentration and its control factors pre-and-post-the-harvest of kelp in Sanggou Bay. Journal of Fisheries of China, 2015, 39(8): 1178-1186[吴文广, 张继红, 王巍, 等. 桑沟湾水域叶绿素a在海带收获前后的变化及其影响因素. 水产学报, 2015, 39(8): 1178-1186] | |
| Xia B, Chen BJ, Cui Y, et al. Distribution and source of organic carbon in Sanggou Bay in summer. Progress in Fishery Sciences, 2013, 34(1): 44-49[夏斌, 陈碧鹃, 崔毅, 等. 夏季桑沟湾养殖水域有机碳的平面分布特征及其来源分析. 渔业科学进展, 2013, 34(1): 44-49] | |
| Xin FY, Chen BJ, Qu KM, et al. The distributions of COD, nitrogen and phosphorous nutrients and nutrient status in Rushan Bay. Marine Fisheries Research, 2004, 25(5): 52-56[辛福言, 陈碧鹃, 曲克明, 等. 乳山湾表层海水COD与氮、磷营养盐的分布及其营养状况. 海洋水产研究, 2004, 25(5): 52-56] | |
| Yin XC. The geochemical characteristics of nitrogen in seawater of the Sanggou Bay. Bulletin of Mineralogy, Petrology and Geochemistry, 1988, 7(1): 4-5[尹相淳. 桑沟湾海水中氮的地球化学特征. 矿物岩石地球化学通报, 1988, 7(1): 4-5] | |
| Zhang JH, Jiang ZJ, Wang W, et al. Seasonal distribution and variation of nutrients and nutrients limitation in Sanggou Bay. Progress in Fishery Sciences, 2010, 31(4): 16-25[张继红, 蒋增杰, 王巍, 等. 桑沟湾营养盐时空分布及营养盐限制分析. 渔业科学进展, 2010, 31(4): 16-25] | |
| Zhang JH, Ren LH, Xu D, et al. Analysis of water quality of abalone suspended long-line mariculture area of Sungo Bay. Journal of Fisheries of China, 2011, 35(6): 897-904[张继红, 任黎华, 徐东, 等. 桑沟湾筏式养鲍区水质分析. 水产学报, 2011, 35(6): 897-904] | |
| Zhang JH, Wang W, Han TT, et al. The distributions of dissolved nutrients in spring of Sungo Bay and potential reason of outbreak of red tide. Journal of Fisheries of China, 2012, 36(1): 132-139[张继红, 王巍, 韩婷婷, 等. 桑沟湾春季营养盐分布特征及赤潮暴发诱因. 水产学报, 2012, 36(1): 132-139] |


